Python dashboard
Northstar sales dashboard.
An interactive view of retail and B2B sales, using synthetic transaction data.
- My role
- Solo build: data generation, analysis logic, and dashboard UI
- Built with
- Python, Streamlit, Pandas, Plotly
- Take a look
- View source
The challenge
Sales data is only useful if the person looking at it can slice it the way they actually think about the business, by region, channel, segment, and time period, without digging through raw spreadsheets or crashing on an empty filter.
What I did
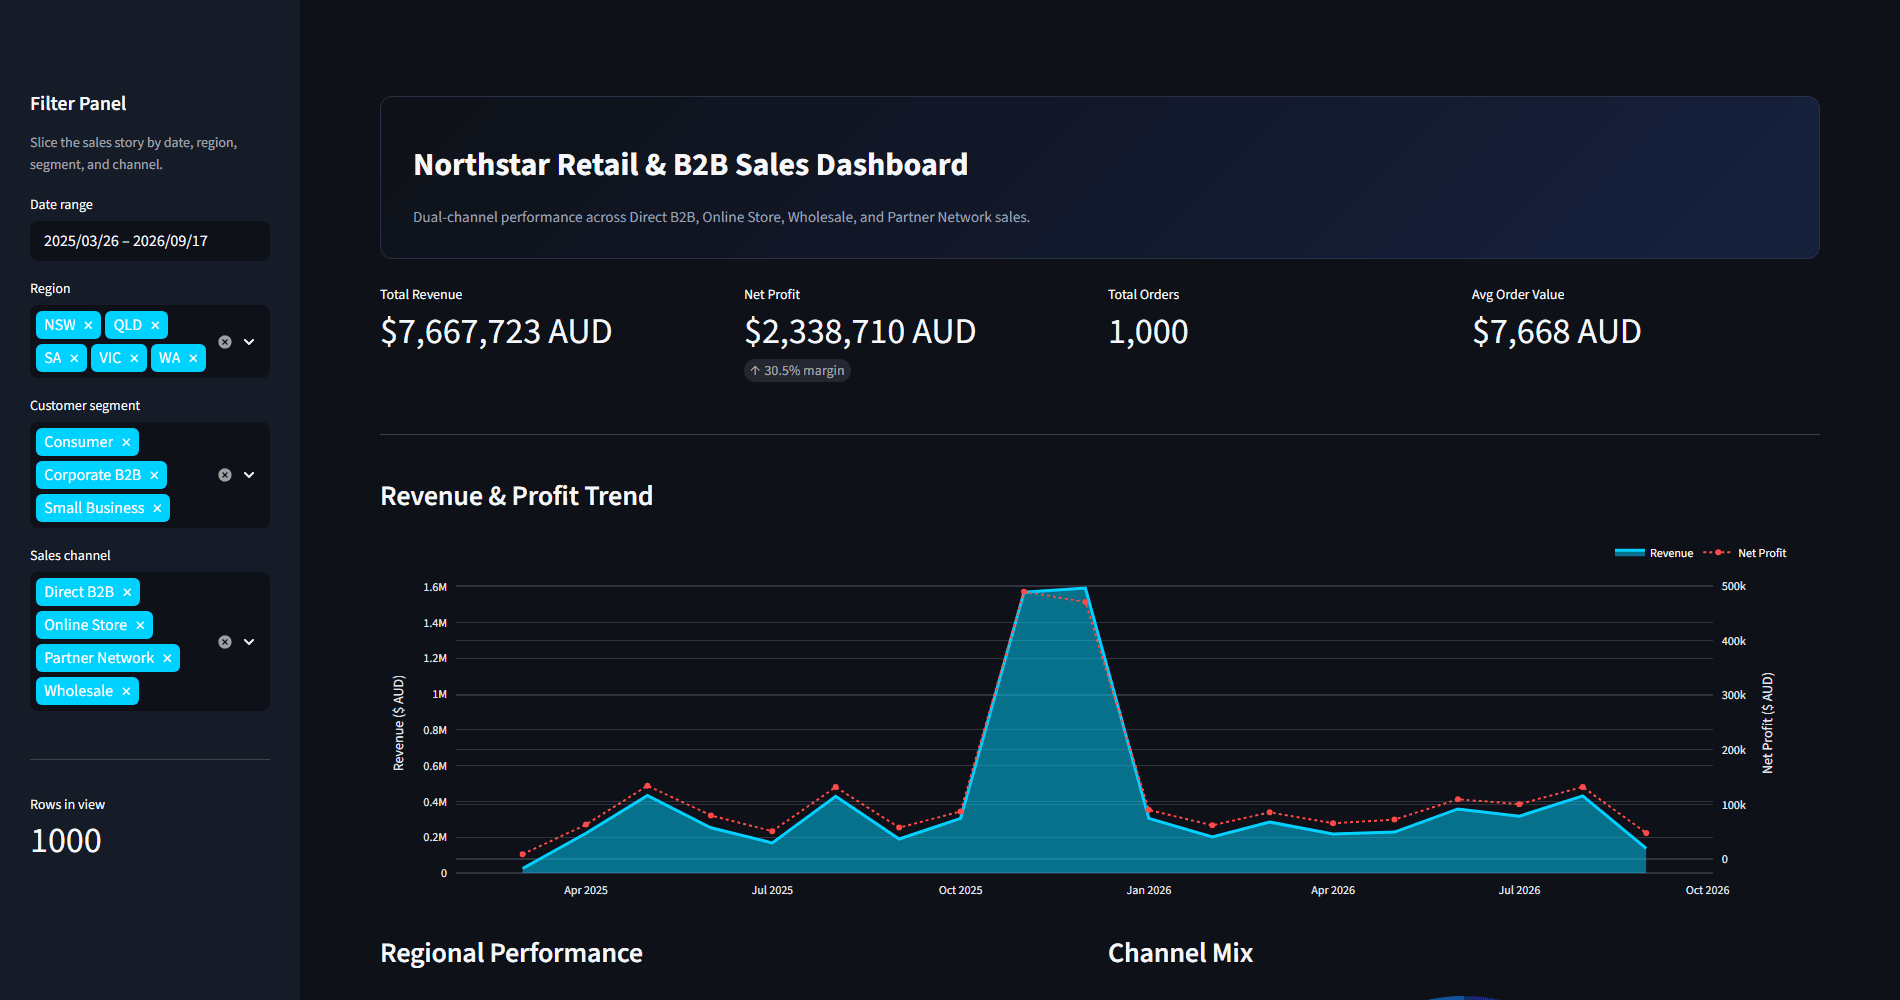
I built a generator that models a coherent dual-channel business, then wired cached, interactive filters into the dashboard so every KPI and chart updates live, with a clean fallback when a filter combination returns nothing.
- Built a deterministic transaction generator modeling a dual-channel business: 5 AU regions, 3 customer segments, 4 sales channels, and 4 product categories, with segment-aware channel weighting so the data reflects a coherent business model rather than pure noise.
- Implemented KPI cards for revenue, net profit and margin, order count, and average order value, plus a dual-axis revenue/profit trend, regional performance, channel mix, and a top-10-products chart colored by category.
- Added a guardrail: filter combinations with zero matching rows show a clean alert banner instead of an unhandled exception.
The result
A cached, filterable dashboard with 4 KPI cards (revenue, net profit and margin, orders, AOV) and 4 charts covering trend, region, channel mix, and top products, across roughly 1,000 transactions.
Next project