SQL analysis
A closer look at retail.
Churn, retention, and revenue explored through PostgreSQL. Built on synthetic data.
- My role
- Solo build: schema design, synthetic data generation, SQL analysis, and testing
- Built with
- SQL, PostgreSQL, Python, Pandas, Faker, pytest
- Take a look
- View source
The challenge
It's easy to demonstrate basic SQL with a SELECT and a GROUP BY. It's harder to show the kind of analysis an actual analyst does, churn scoring, cohort retention, and rolling regional metrics, on data realistic enough for the findings to mean something.
What I did
I built a normalized schema and a synthetic data generator modeling Australia's two dominant grocery banners, then wrote three advanced window-function analyses in PostgreSQL, each validated by a pytest data-integrity suite.
- Designed a normalized schema (customers, stores, products, transactions) modeling Woolworths Group and Coles Group banners across NSW, VIC, QLD, and SA, seeded with ~1,500 customers, 45 stores, and 10,000 transactions via Pandas and Faker.
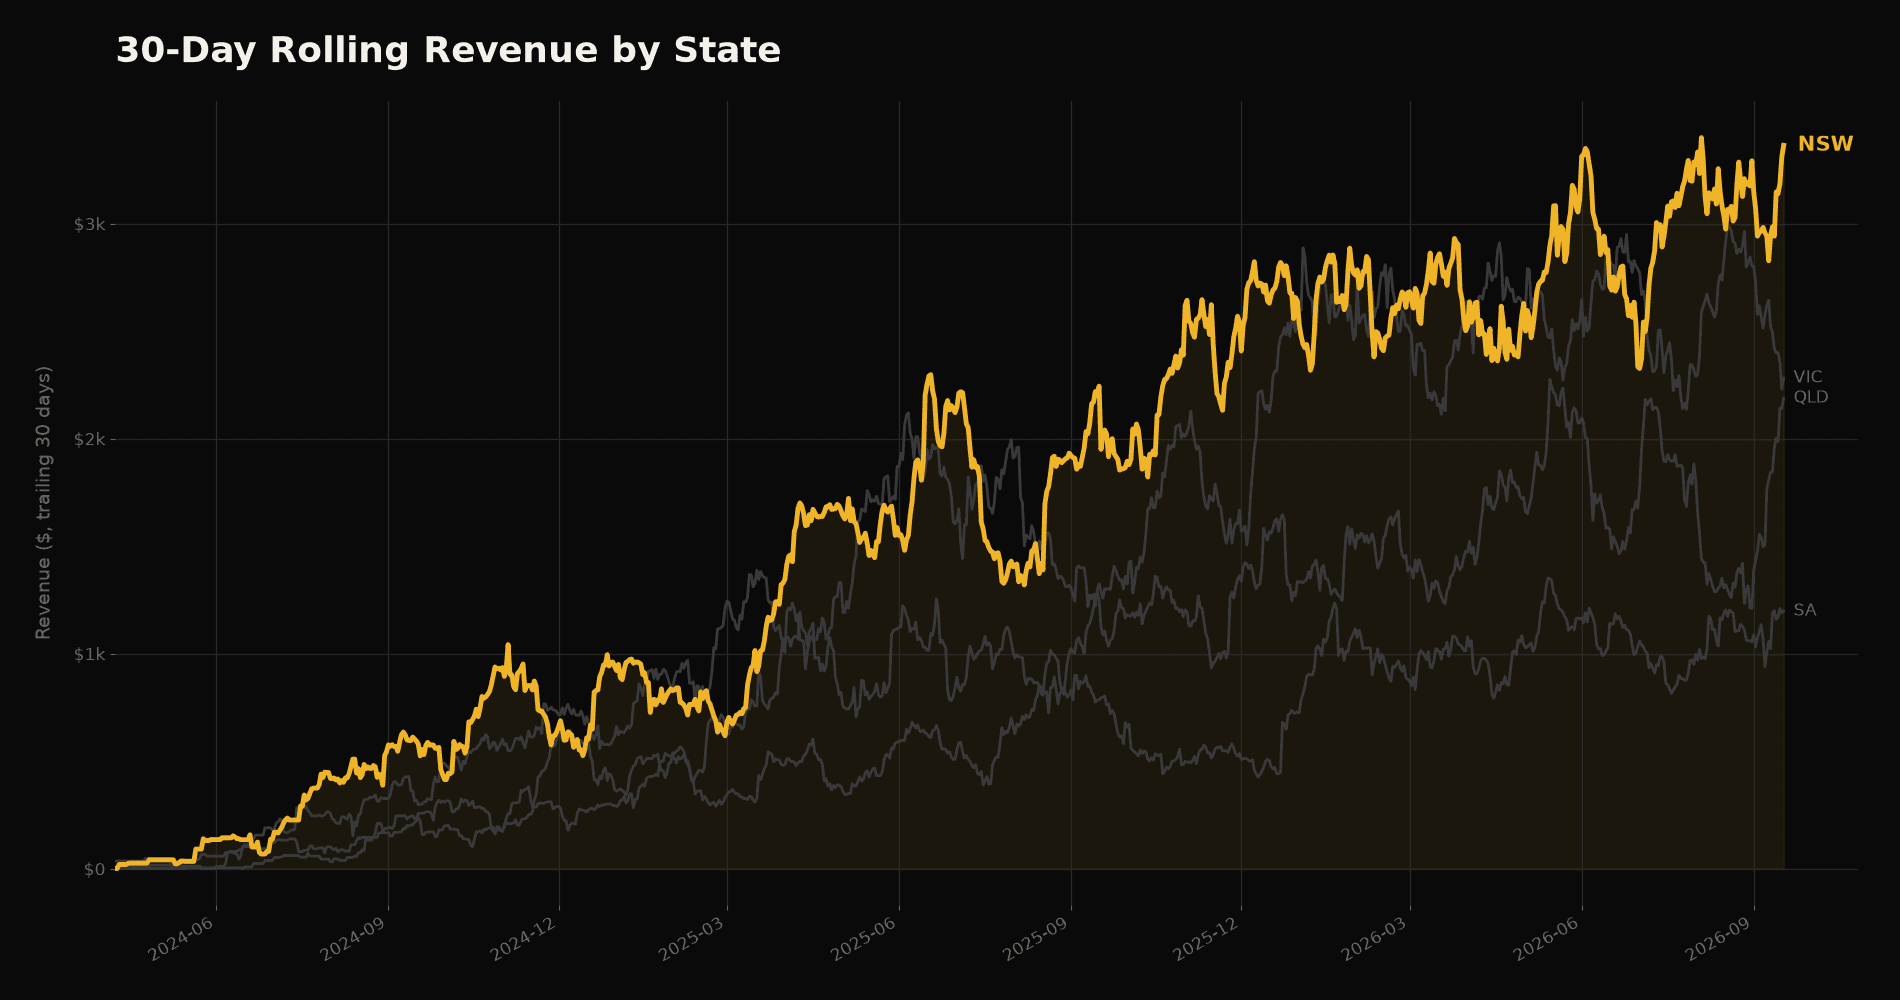
- Wrote three advanced analyses: customer churn risk scoring (NTILE spend quartiles plus inactivity thresholds), a cohort retention matrix (COUNT() OVER PARTITION BY), and 30-day rolling revenue and basket size per region built on a full calendar spine (generate_series, LATERAL) with rolling SUM() OVER frames and LAG() for day-over-day change.
- Built a pytest suite checking referential integrity, value ranges, and domain sanity across the generated dataset.
The result
Three advanced window-function analyses covering churn risk, cohort retention, and rolling regional revenue, each backed by a normalized PostgreSQL schema and a data-integrity pytest suite.
Next project